For this analysis, we restrict the comparison to just the major parties, as they were the only parties for which we estimated vote share. We also only compare the actual results to the predictions of our base scenario. In the future, our work will focus much more on scenario planning to explain political campaigns.
We start by plotting the difference between the actual votes and the predicted votes at the party and district level.
 |
| Distribution of the difference between the predicted and actual proportion of votes for all parties |
To better understand this variation, we can look at a plot of the geographical distribution of the differences. In this figure, we show each party separately to illuminate the geographical structure of the differences.
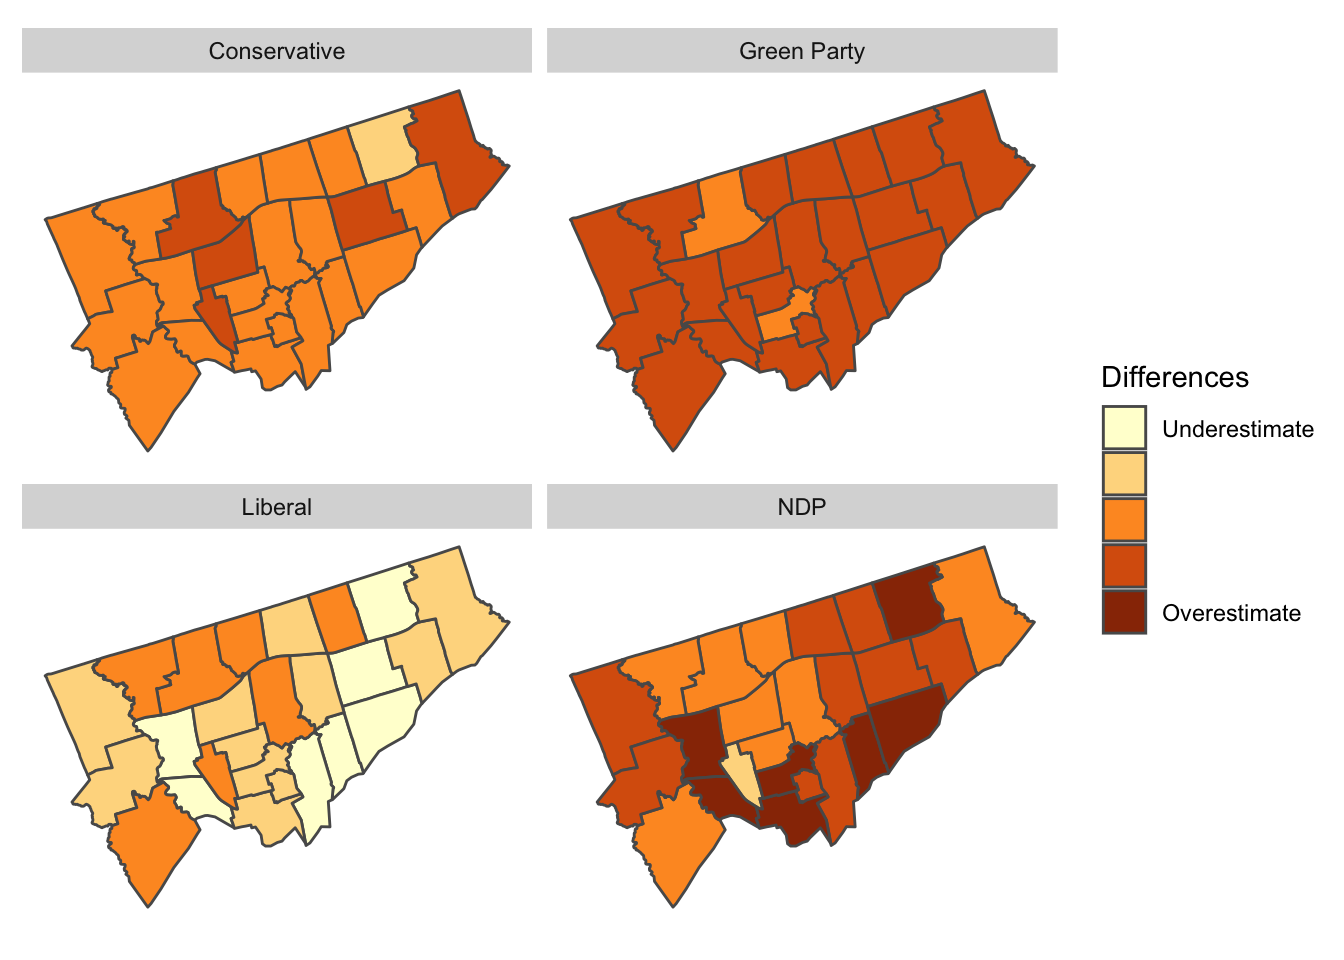 |
| Geographical distribution of the difference between the predicted and actual proportion of votes by Electoral District and party |
The overall distribution of differences doesn’t have a clear geographical bias. In some sense, this is good, as it shows our agent-based model isn’t systematically biased to any particular Electoral District.
However, our model does appear to generally overestimate NDP support while underestimating Liberal support. These slight biases are important indicators for us in recalibrating the model.
Overall, we’re very happy with an error distribution of around 5%. As described earlier, our primary objective is to explain political campaigns. Having accurate predictions is useful to this objective, but isn’t the primary concern. Rather, we’re much more interested in using the model that we’ve built for exploring different scenarios and helping to design political campaigns.